Overview
Improve operational analytics with the generative AI capabilities of Amazon Q Developer in Amazon OpenSearch Service workflows. You can investigate issues, analyze patterns, and create visualizations using in-context assistance and natural language interactions. When an alert monitor is triggered, Amazon Q Developer provides a summary and insights, such as error trends, within the alerts interface. Improve access to operational insights while maintaining enterprise-grade security and governance controls. This reduces mean time to resolution from hours to minutes, enables more self-service troubleshooting, and helps teams extract greater value from their observability data without requiring specialized expertise.

Understand operational data using natural language prompts
Get immediate insights from your operational data through simple natural language questions. The in-context assistance automatically generates visualizations, analyzes patterns, and provides contextual explanations of your data, reducing the need for specialized query expertise.

Accelerate incident investigation and alert management
Quickly understand and respond to operational incidents with AI-powered alert summaries and contextual analysis. When an alert monitor is triggered, Amazon Q Developer produces a summary and insights, such as error trends, within the alerts interface and provides a path to further explore relevant data in the OpenSearch dashboard Discover page. This helps you resolve issues faster by surfacing relevant information during critical incidents.

Automate monitoring setup with AI recommendations
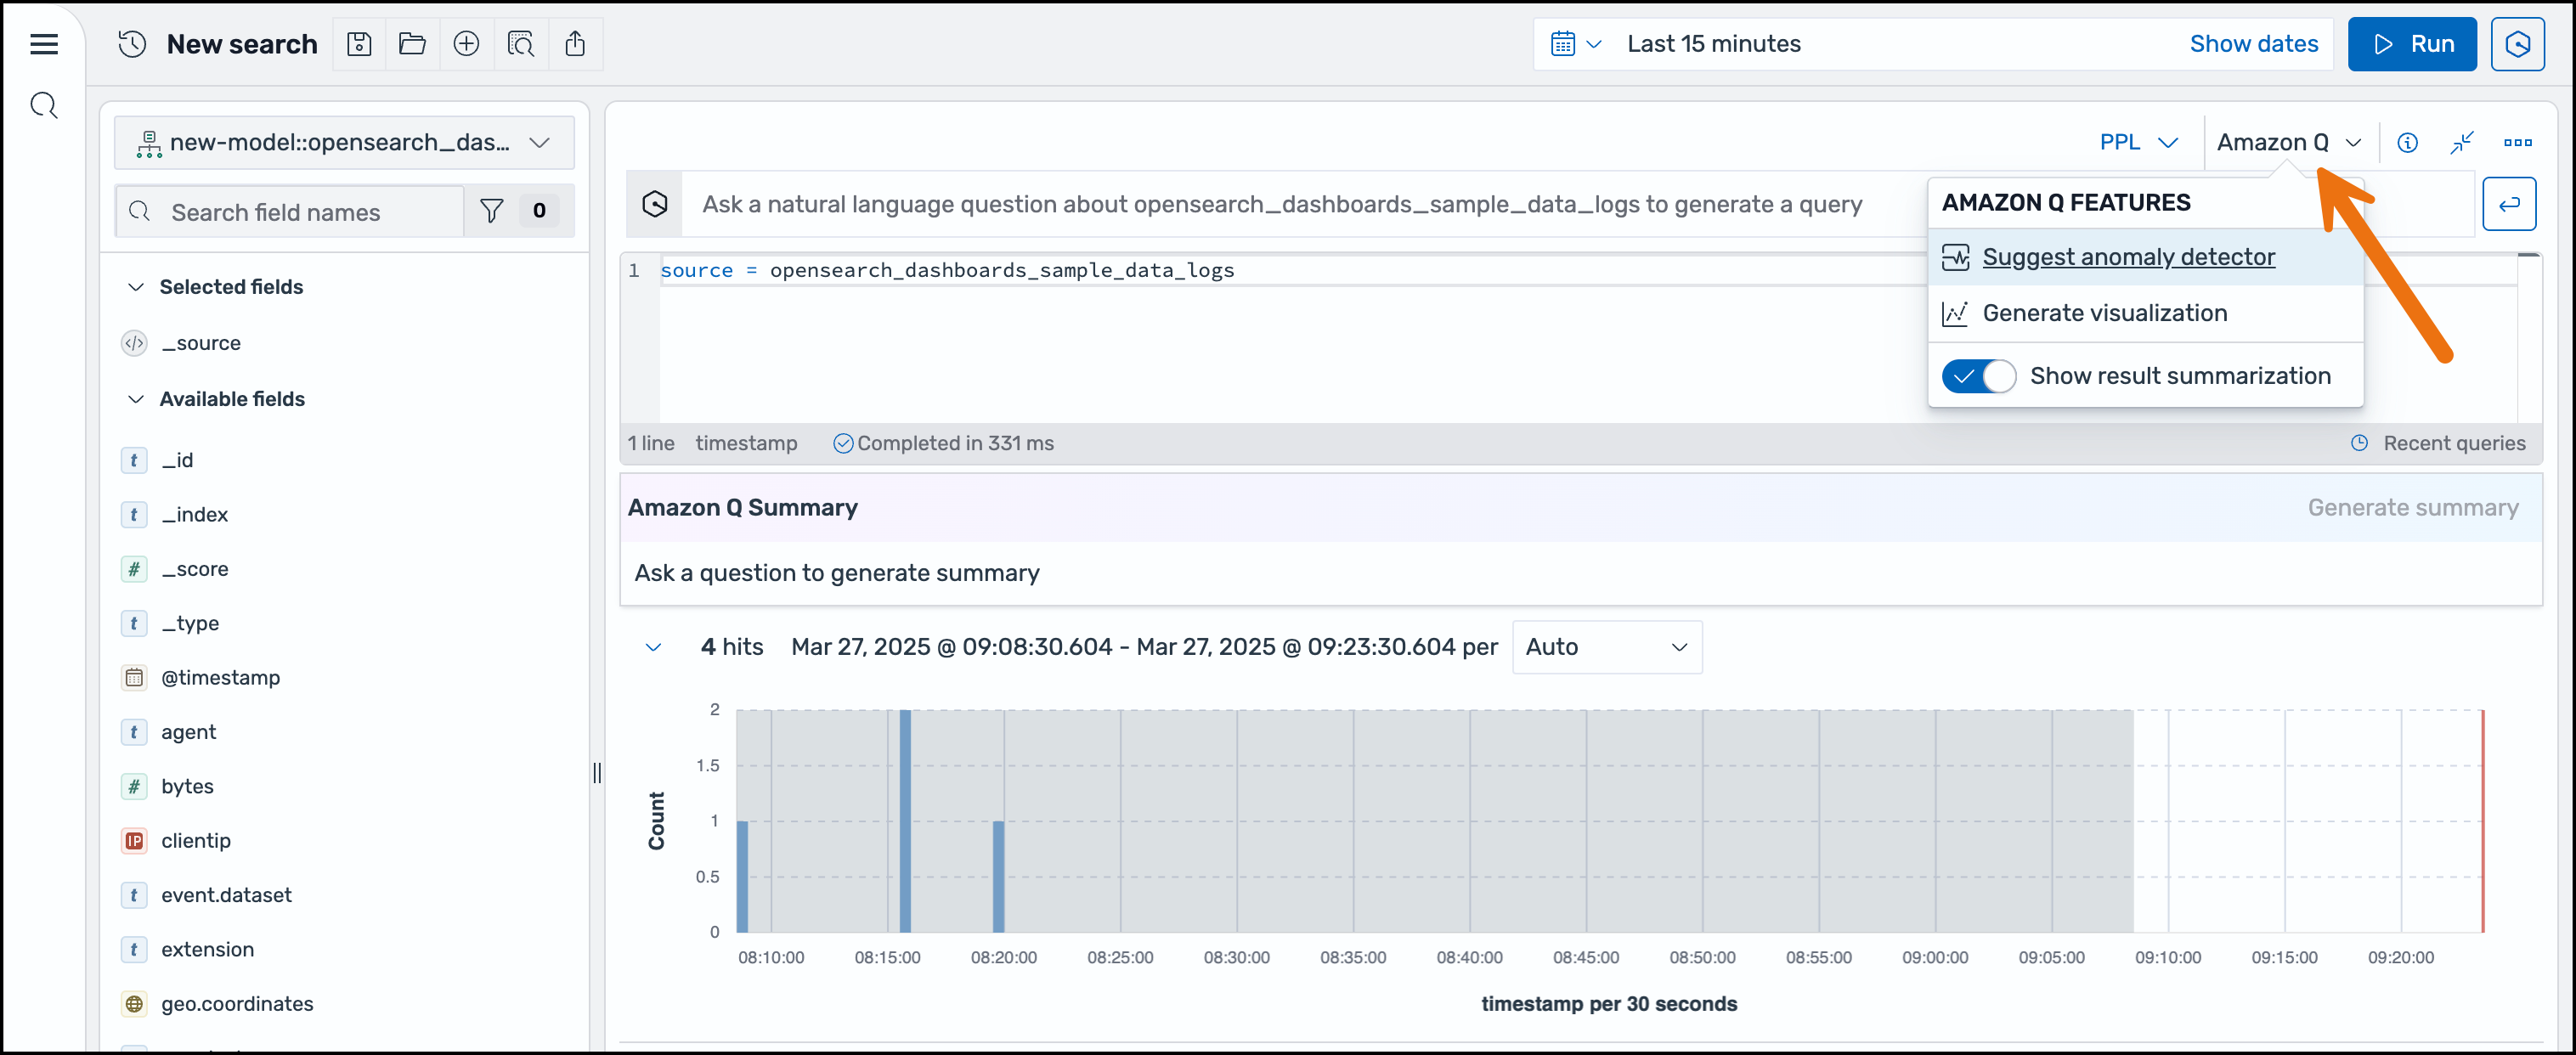
Scale your operational capabilities through automated, context-aware assistance by setting up advanced monitoring capabilities through AI-powered suggestions. The assistant analyzes your data to recommend anomaly detectors to help you identify potential issues earlier and reduce mean time to resolution.

What types of data exploration queries and visualizations can Amazon Q Developer build?
Learning:
- "What’s the average request size by week?"
- “How many requests by response code were there last week?”
- “Are there any errors in my logs?”
Building:
- "Show me all HTTP 500 errors grouped by service name."
- "Create a trend visualization of memory usage over the last week."
- "Display the top 10 highest latency requests by endpoint."